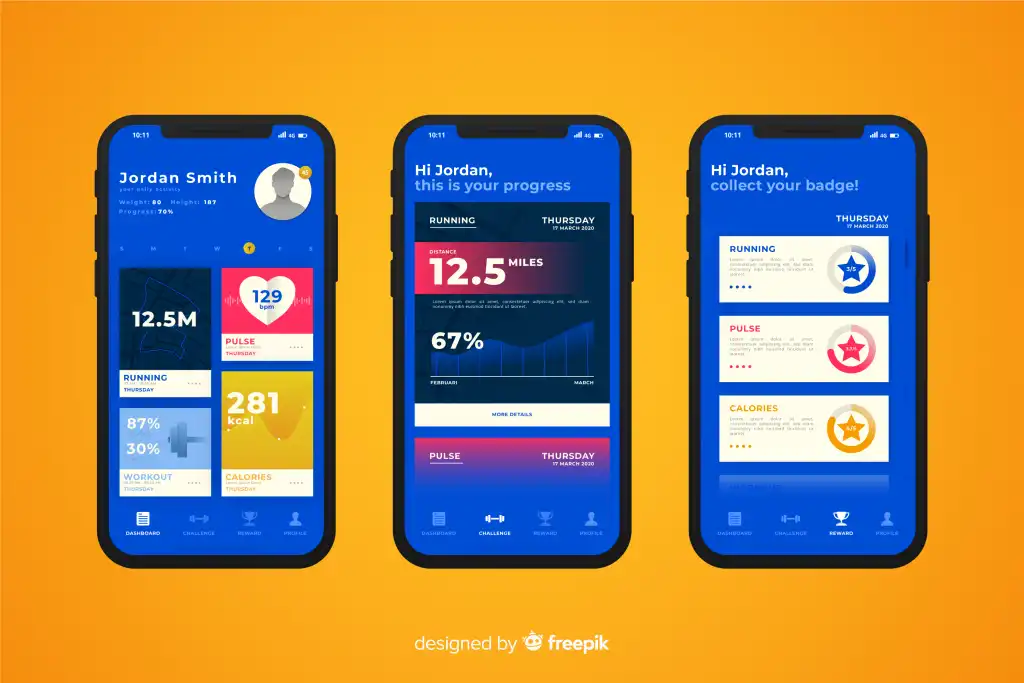









How to identify the pages that cause the highest app exit rates.
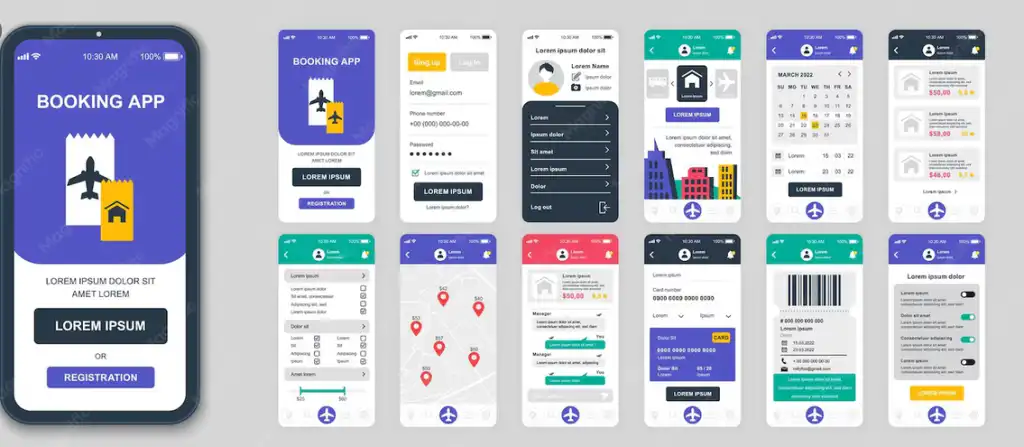
Exit rates reveal weaknesses in the user journey.
Page exit rates are a crucial indicator for understanding where the user journey stalls within an application; they allow business owners to determine whether users continue to complete required steps or drop off before reaching the final goal.
This metric should not be viewed in isolation from other data, as interpreting it requires an understanding of the page's nature, its purpose, and its specific stage within the user journey.
For instance, a high exit rate on an informational page might be normal, whereas the same rate on an order completion page could signal a problem that directly impacts sales.
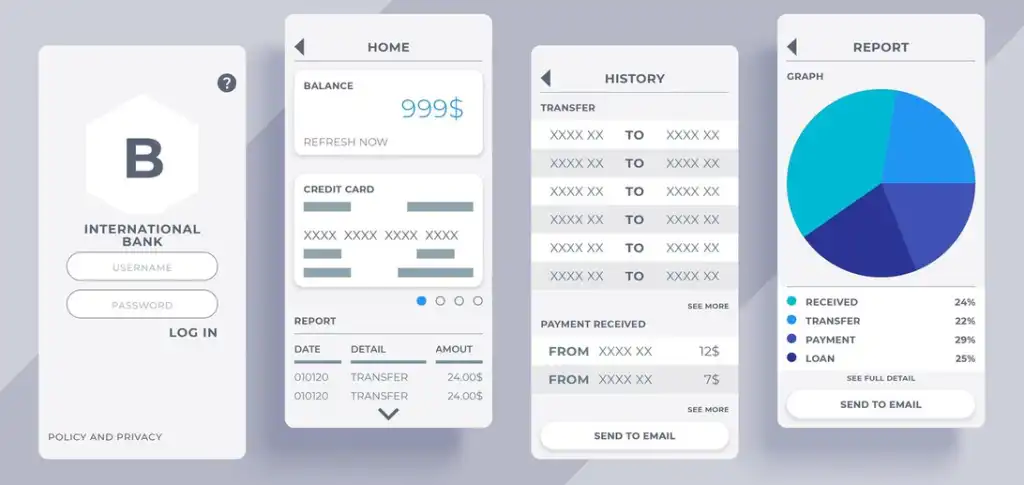
How App Analytics Reveal Where Users Drop Off
App analytics give business owners insight into what happens behind the user interface; they go beyond merely showing how often the app is opened to reveal which pages users visit, how much time they spend on them, and the steps they take before leaving the app.
This data is crucial when an app owner wants to understand why the number of orders, registrations, or bookings is low despite having a healthy user base.
An app might attract significant traffic, yet users may stall at a specific page before completing the desired action; identifying that page becomes a vital step in diagnosing the problem.
By configuring the appropriate in-app events, it is possible to track navigation, clicks, form submissions, product additions, payment initiation, and other actions that reflect genuine user interaction.
Once this data has been collected over a sufficient period, the performance of different pages can be compared to pinpoint where the steepest drop-offs occur.
However, interpreting the data requires an understanding of the app's specific nature, as a page serving as a natural exit point in one app might signal a serious issue in another.
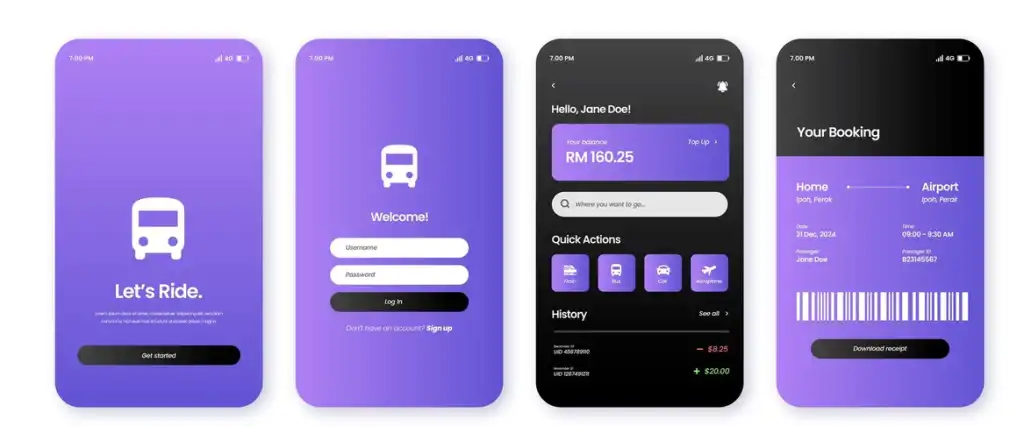
Identifying User Drop-off Points Within the App
Analyzing user drop-off points within an app helps identify the stages where user numbers noticeably decline. This is crucial for any project aiming to improve user retention and increase completed actions, rather than simply driving traffic to the app.
An app might successfully attract a user and prompt them to log in or browse products and services; however, issues often arise when the user reaches a screen requiring a specific action but finds no easy or clear way to perform it.
This highlights the importance of tracking the entire user journey, rather than merely monitoring app launches or the number of active users over a specific period.
Analytics tools enable you to track how many users begin a specific journey versus how many complete it, making it possible to pinpoint the stage where the sharpest drop in engagement occurs.
If a large number of users reach a specific page but leave before proceeding to the next, that page requires closer analysis to determine the reason for the user loss.
The cause could be related to how information is displayed, a lack of clarity regarding the required action, an excessive number of form fields, or difficulty locating the primary button intended to advance the user to the next step.
Why Do Users Quickly Leave Certain App Screens?
A user quickly exiting a specific screen can indicate a problem requiring analysis, especially if this behavior is repeated by a significant number of users reaching that same screen under similar circumstances.
The root cause cannot be determined by the exit rate alone; a user might leave due to slow loading times, unclear content, navigation difficulties, or the absence of the information they were seeking.
Therefore, the analysis process begins by identifying the primary goal of each screen within the app. The effectiveness of a screen intended to prompt a specific user action should be measured by its ability to achieve that goal.
For instance, if a service page is designed to encourage bookings, a high volume of visits without a corresponding rise in bookings may signal an issue with the booking experience itself.
A user might find the service information clear but fail to figure out how to schedule an appointment or locate the booking button easily, leading them to leave despite their interest in the service.
In shopping apps, a user might visit a product page and view images, descriptions, and prices, yet exit before adding the item to their cart if details regarding sizing, delivery, or stock availability are unclear.
Image quality and loading speed can also influence user decisions; slow-loading key elements may create the impression that the app is unstable or sluggish to respond.
Analytics tools allow us to track the time a user spends on a screen before exiting—a metric that can be compared against the behavior of users who successfully completed the desired action.
If users who complete the process interact with specific elements while those who leave do not, there may be an issue with the clarity or placement of those elements. It is also possible to analyze on-screen clicks to determine whether the user is attempting to access something that does not exist or is clicking on elements they believe to be interactive.